Log in
Book a demo

Analytics

See how your org works, beyond the org chart

Reports on AI adoption, Windmill engagement, 1:1 habits, and how your teams really collaborate. Built from the work data you already have.


RhoKalshiThe Farmer's DogCal.comMergeNalaInngestCal.comOrigamiRoamKoddiallwhereUdioRetailNextNirvanaCounterpartTickPick

Five reports, zero setup

People analytics without the analyst

Windmill's stats engine turns activity from your connected integrations into reports you can act on.

Network

Each dot is a person; each line is a working relationship

EngineeringExecutiveSalesSupportMarketing

Network overview

People
48
Relationships
214
Communities
5
Modularity
0.62

AI Adoption

Know if the AI tools you pay for get used
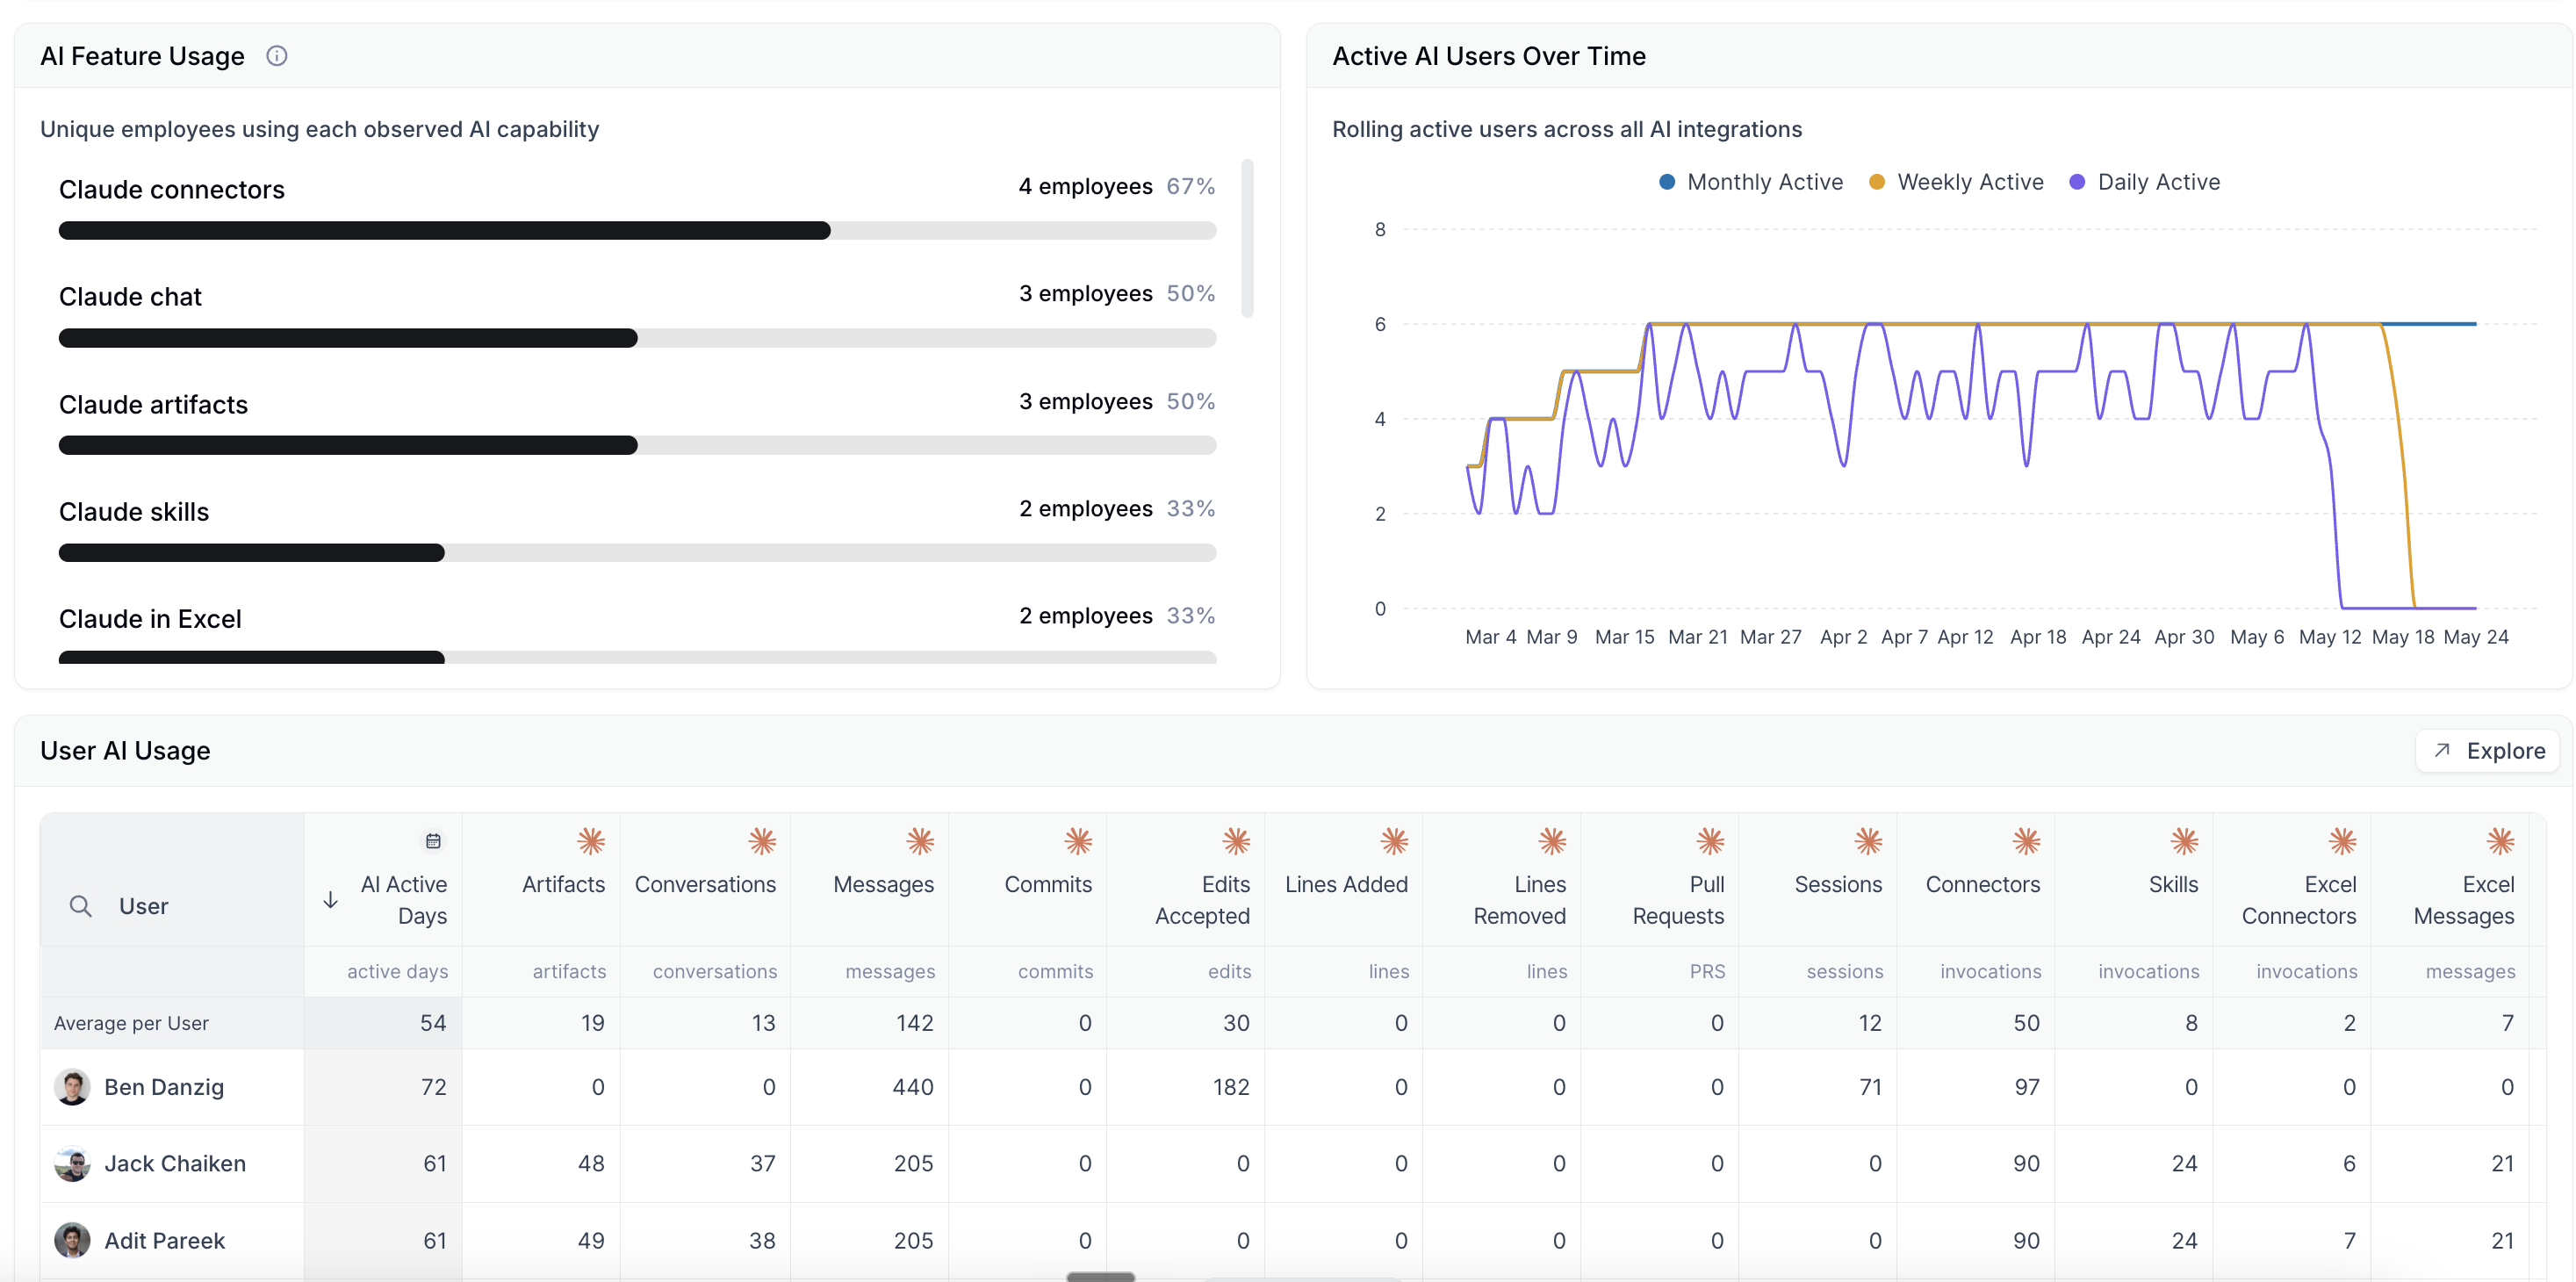
Adoption rates, daily and weekly actives, and per-capability usage for Claude, Codex, Cursor, and Devin, down to the individual user.
AI Adoption Report

Organizational Health

Map who really works with whom

Organizational Health maps collaboration across your company, using organizational network analysis on signals like shared meetings, messages, code reviews, tasks, and documents.

Most connected

The people most central to how work flows.

Critical connectors

Often the people whose departure would fragment collaboration.

Cross-team linkers

The people whose relationships reach most broadly across teams.

Organizational Health surfaces collaboration patterns and strength, never the contents of anyone's messages, emails, or documents.
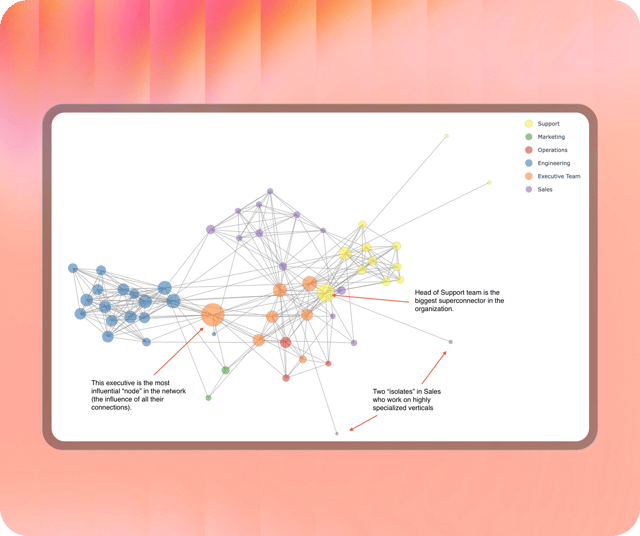
ONA With Background

How it works

From connected tools to answers in minutes

No instrumentation, no data team, no dashboard project.

1. Connect your tools

Slack, GitHub, Jira, Google Workspace, and AI tools like Claude and Cursor connect in a couple of clicks.

2. Windmill aggregates the signals

The stats engine automatically turns raw activity from every integration into per-person, per-day stats.

3. Open a report

AI Adoption, Product Usage, Organizational Health, and 1:1 Meetings are pre-built and ready the moment data lands.

4. Drill down, export, share

Click any number to see the people behind it, export to CSV, or share a link. Every report view is saved in the URL.

The problem

Why people data stays invisible

The signal already exists. It's just trapped in a dozen tools, quarterly surveys, and a BI backlog.
Manual
Scattered across tools
Meetings in Calendar, code in GitHub, chatter in Slack, AI usage in four different admin consoles. Nobody sees the whole picture.
Infrequent
Surveys tell you too late
Engagement surveys are lagging indicators. By the time a team shows up disengaged, the damage is months old.
Generic
Org charts aren't reality
Reporting lines say who should work together. They can't show who really does, or who's quietly isolated.
Frustrating
BI projects take quarters
Getting people data into a BI tool means a data team, a backlog, and months of waiting for a single dashboard.
Faq

Frequently asked questions

Who can see Analytics data?
Workspace Admins and Data Analysts see Analytics for the entire organization. Managers see Analytics for themselves and anyone who reports to them, directly or indirectly. Other members see their own data, plus any employees they've been delegated access to. Filters in every report are scoped to what the viewer is allowed to see, so a manager can't filter to employees outside their reporting line.
Does Organizational Health show the contents of anyone's messages?
No. Organizational Health surfaces collaboration patterns and strength: who works with whom, and how much. It draws on signals like shared meetings, messages, code reviews, tasks, and documents, but never shows the contents of anyone's messages, emails, or documents. 1:1 notes stay private to their participants.
Which AI tools does the AI Adoption report track?
AI Adoption tracks Claude, Codex, Cursor, and Devin. Connect at least one of these integrations and Windmill turns their usage signals into adoption rates, trend charts, and per-user activity, including which specific AI capabilities, like Claude Code or Cursor Tab, each team uses.
Can I export data from Windmill Analytics?
Yes. The per-user tables in AI Adoption and Product Usage export to CSV, and the Explore report exports any custom stat selection as raw per-employee, per-day rows. Every report view is also saved in the URL, so you can bookmark a filtered view or share it with a link.
Do we need a BI tool or a data team to use Analytics?
No. The reports are pre-built, and Windmill's stats engine aggregates activity from your connected integrations automatically. When you want to go beyond the pre-built reports, Explore is a point-and-click builder: pick stats, filter employees, choose a chart type, and you're done.
Where do I see results for a specific Pulse survey?
Each Pulse survey has its own results report with response-level detail, filtering, and AI summaries. The Product Usage report in Analytics tracks Pulse at the engagement level: how many people are responding to and creating surveys across the organization.